Engaging & playful data visualization
EXPLORE
Design Week | Future poll I Data visualization
BRINGING DATA TO LIVE
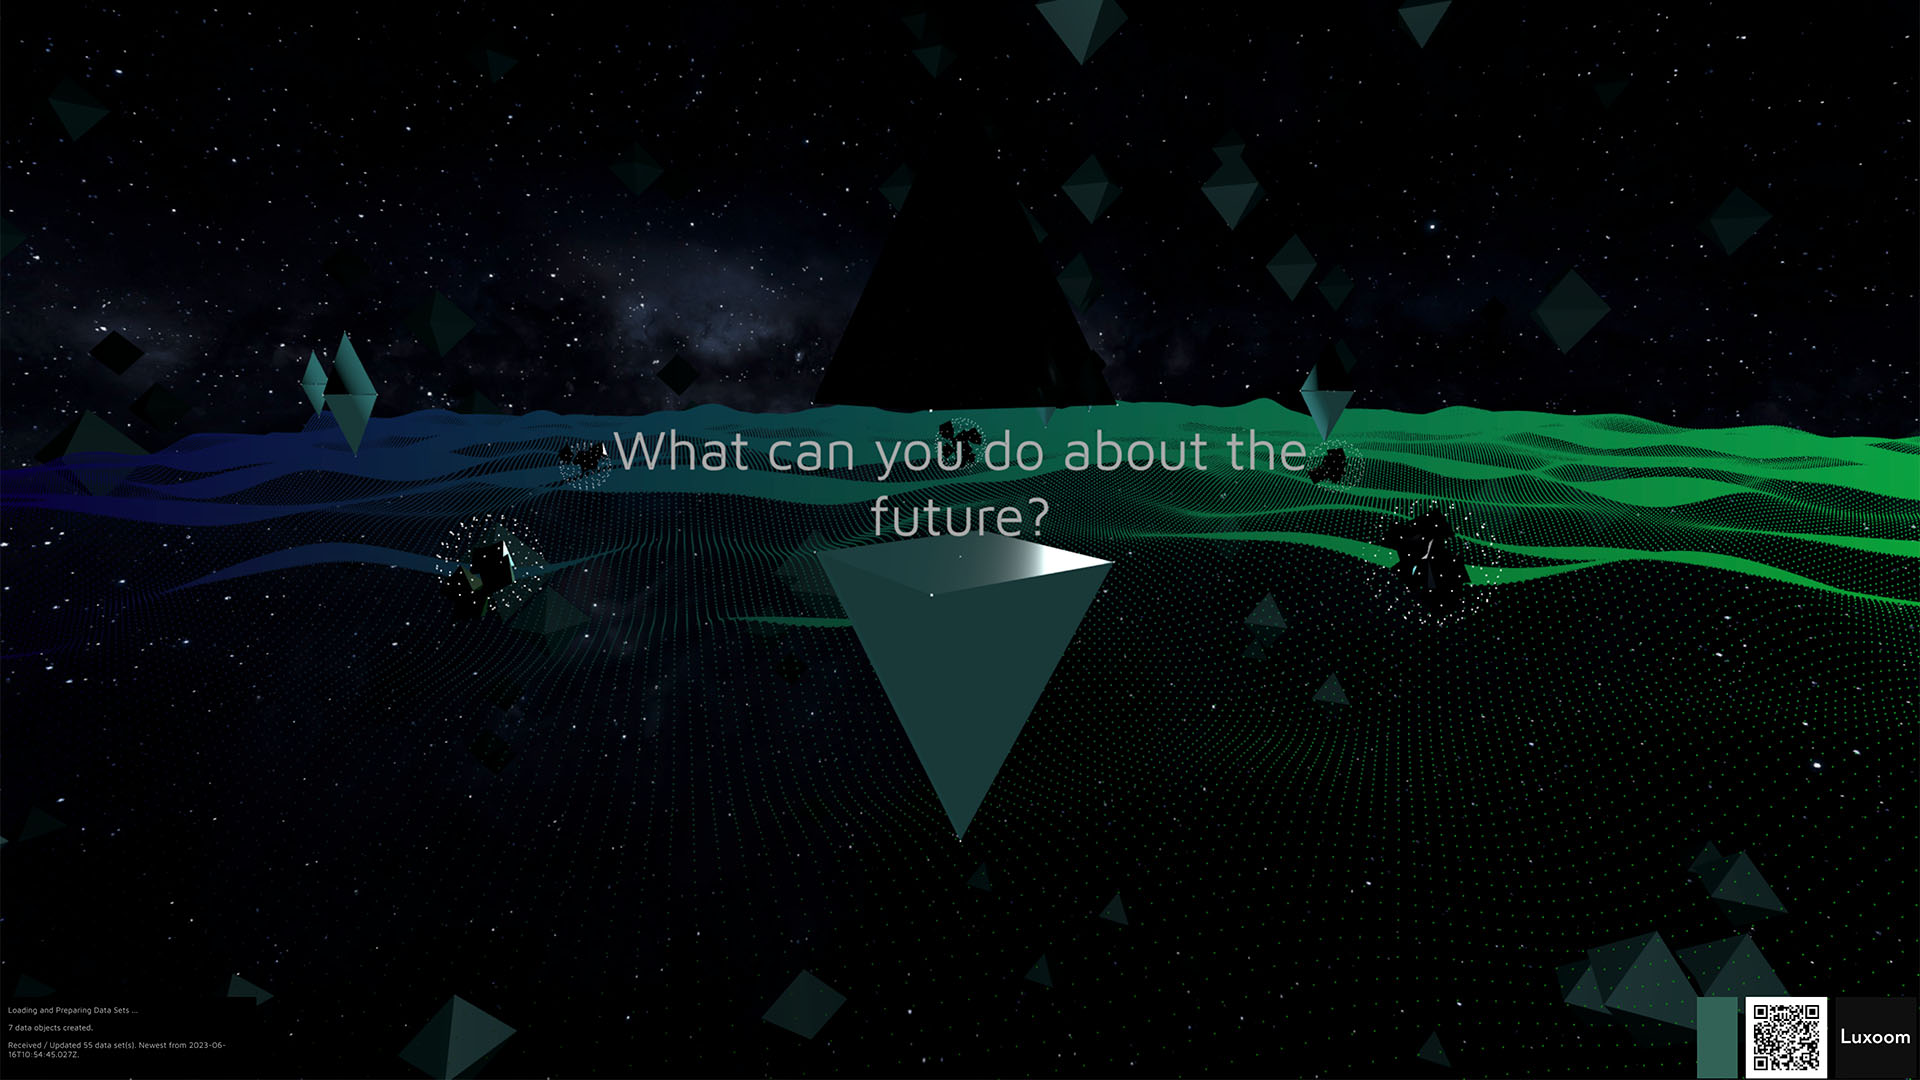
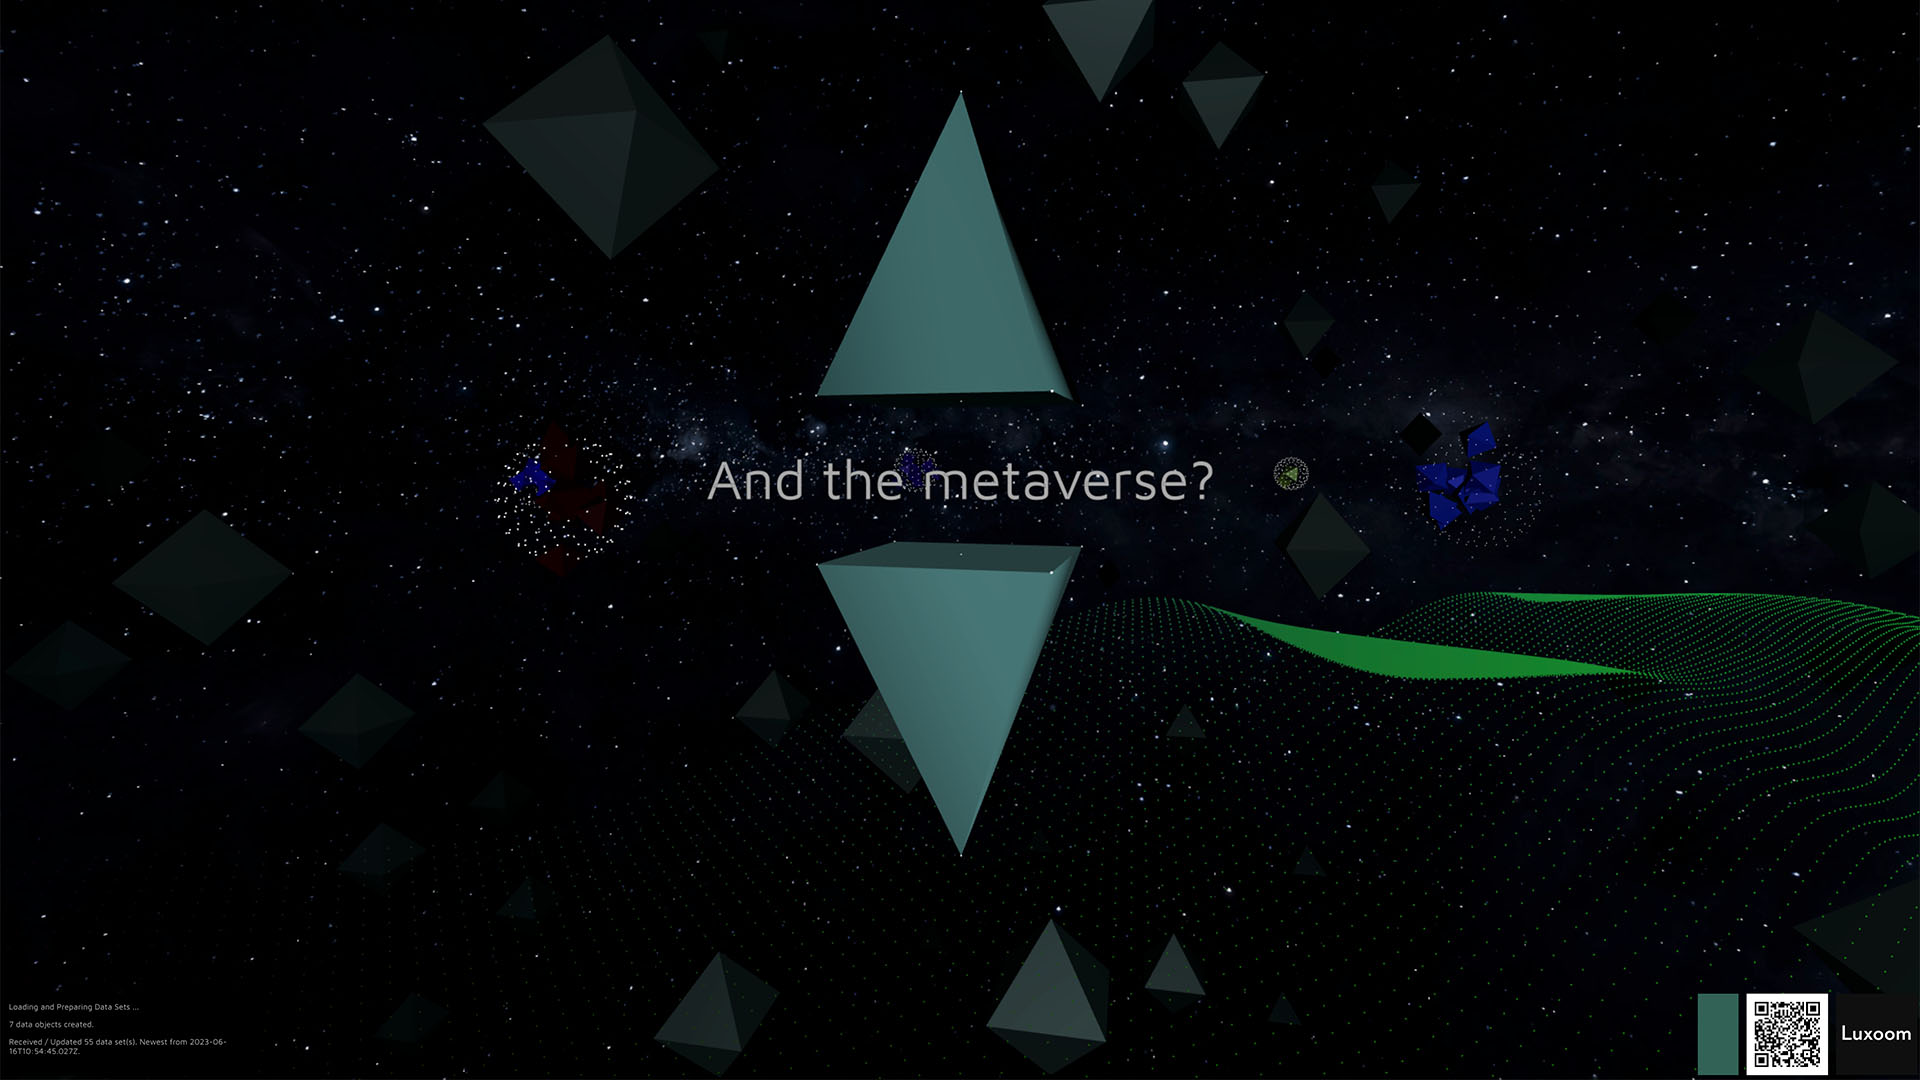
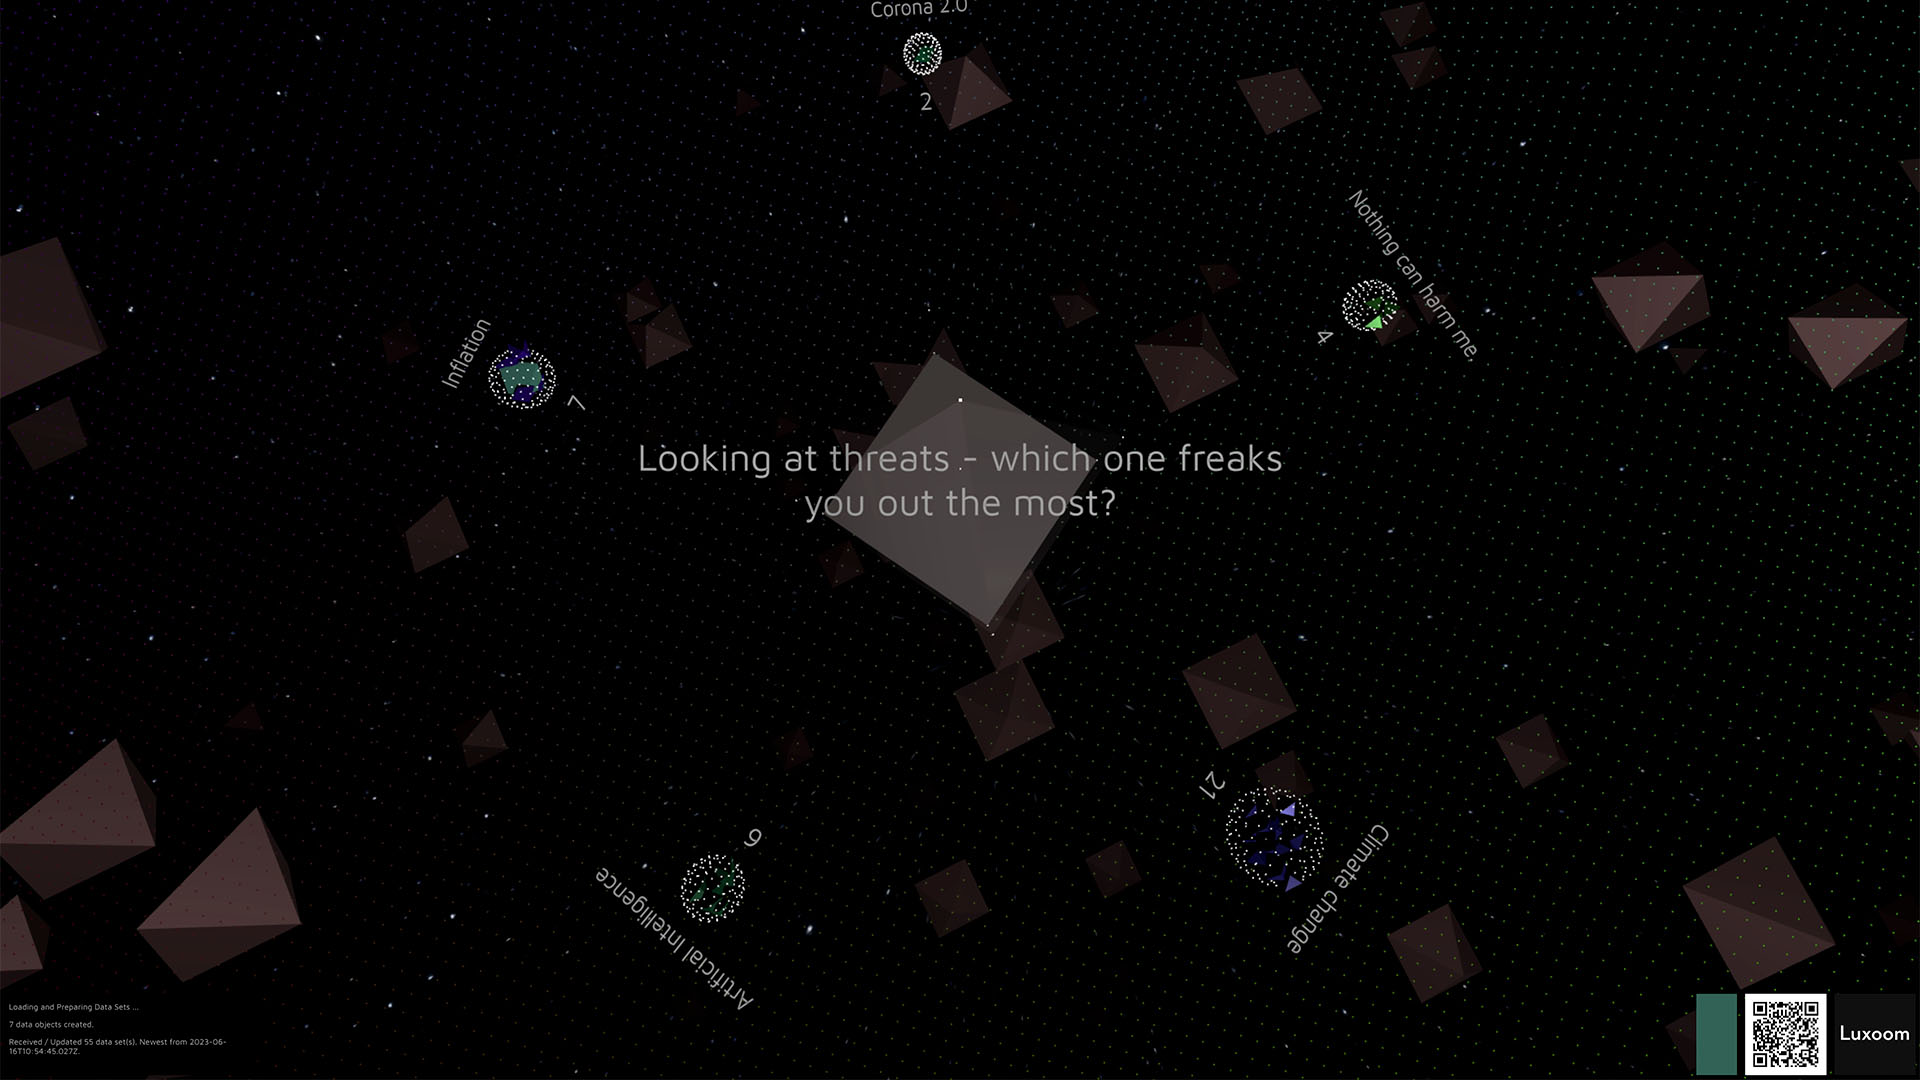
Artificial intelligence, climate change, quantum computing – a wide breadth of topics start grabbing our attention and inducing change into our private and work lives. We wanted to playfully know how You cope and created a polling system for the Berlin Design Week ’23. Using their own device, participants generate live data results that become explorable in a WebGL-browser based visualizer application. Enjoy an automated tour through the data sets or grab a mouse and deep-dive into the diagrams – realized with a combination of MongoDB, React, NodeJS and ThreeJS.
EXPLORING WebGL UX / UI
Venturing off the well tested paths of UX / UI design is usually an invitation to fail in a client project. So, test projects like this are the number one tool to gather learnings on how users adapt to explorative UX schemes. The two screen combination of using your smartphone to live-interact with a browser-based visualizer is a intuitive enabler for interaction beyond touch-screens, keyboards and location based interfaces. Scan the QR code, partake in the poll and see your and other participants data fly in live into the poll results.


